
Spreadsheets keep getting taller. Deadlines keep getting shorter. The quiet shift is that artificial intelligence in data analysis now works like a sharp junior analyst who never gets tired. You ask for a result, it returns a cleaned dataset, a chart, and a short brief. No drama. Just signal.
This guide verifies the current capabilities of the leading AI tools for data analysis, explains exactly how to connect your data to ChatGPT, lays out a crisp 4-step AI data analysis process, and finishes with a ten-minute workflow you can run today. Two tables are included for quick comparison and planning.
Table of Contents
1. What Artificial Intelligence In Data Analysis Really Means
Artificial intelligence in data analysis is the practice of turning raw data into decisions with three layers working together.
- Machine Learning As The Engine. Models spot structure, quantify relationships, and forecast outcomes.
- Natural Language As The Interface. You ask questions in English, the system translates those into SQL, Python, or vector ops.
- Generative Models As The Narrator. After the math, a model writes summaries, annotates charts, and shows the code it used.
The payoff is practical. Faster cycles. Deeper pattern finding. Wider access, because the interface is conversation, not a wall of formulas. The phrase artificial intelligence in data analysis no longer means theory. It is a daily habit.
2. The AI Data Analysis Process, A Four-Step Playbook
This AI data analysis process mirrors a careful human workflow, only faster.
2.1 Ingest And Clean
Start with your CSV, Excel workbook, database table, or Google Sheet. Ask your tool to profile columns, fix casing, standardize dates, deduplicate rows, and show a before-after diff. Artificial intelligence in data analysis shines here because cleaning is deterministic work that code does perfectly.
2.2 Explore And Discover

Ask open questions. “What stands out in this dataset.” Follow with specifics. “Show outliers in unit price,” or “Rank the strongest correlations among numeric columns.” Good systems return compact stats, candidate visuals, and a shortlist of leads.
2.3 Model And Forecast
Move from description to prediction. “Forecast next quarter with confidence intervals,” or “Estimate the effect of discount percentage on margin while controlling for region.” Keep your scientist hat on. Request the assumptions and residual checks with the answer. Artificial intelligence in data analysis is powerful, and it is even better when you keep it honest.
2.4 Communicate And Decide
Ask for the right views. “Create a bar chart of sales by region,” and “Write a two paragraph summary that an exec will read.” Package code when you need transparency. Decisions travel farther when the story is clear.
3. How To Connect Your Data To ChatGPT, Verified

You can connect files directly in a chat, and you can also link cloud drives through Connectors.
Direct file uploads. Use the paperclip or plus icon in ChatGPT to attach spreadsheets and documents, then ask for analysis or visualization. OpenAI’s File Uploads FAQ explicitly calls out uploading spreadsheets and asking ChatGPT to analyze and chart them.
Connected apps, Google Drive and Microsoft storage. Pro, Team, Enterprise, and Edu plans can enable Connectors that let ChatGPT fetch and analyze selected files from Google Drive, OneDrive, SharePoint, Dropbox, and Box. The official help center documents “Connectors” and “Add files from connected apps”, including step-by-step setup.
Google Drive nuance. OpenAI’s “synced connector” note clarifies that the self-service Google Drive connector supports Google Workspace Drive today, not personal Drive accounts, and that embedded images or charts in those files are not parsed. Admin-managed Workspace setup is available for organizations.
Enterprise upload paths. ChatGPT Enterprise documents multiple routes, including direct upload, Google Drive, SharePoint, OneDrive, Projects, and GPT Actions. That makes the same analysis reproducible across teams.
In short, connecting data to ChatGPT is now simple. Upload a file, or click Add from apps, authorize your Drive or Microsoft storage, and select the files you want to analyze. Those steps map cleanly to the screenshot you shared, which shows both “Add photos & files” and “Add from Google Drive.”
4. The 2025 Tooling Landscape, Verified Snapshot
The four tools below cover most needs. Pricing and feature notes are taken from vendor pages and support articles published in 2024 and 2025.
4.1 Quick Snapshot Table
| Tool | Best For | Starting Price | What Stands Out |
|---|---|---|---|
| ChatGPT, Advanced Data | Flexible, conversational analysis | Included with paid ChatGPT tiers that support file upload and Connectors | File uploads, Projects, and Connectors for Drive, SharePoint, OneDrive, Dropbox, and Box. Upload a CSV and ask for code, charts, and summaries. |
| Julius AI | Teams, notebooks, and live data | Free tier, Plus 20 USD per month, Pro 45 USD per member per month | Notebooks, collaboration, Google Drive connector on Free and Plus, and Snowflake, BigQuery, Postgres connectors on Pro. Message limits by tier. |
| Microsoft Copilot For Excel | People who live in spreadsheets | Copilot Pro 20 USD per user per month personal, Copilot for Microsoft 365 30 USD per user per month for business | Works in Excel, generates formulas, creates PivotTables, imports data, and offers Python in Excel guidance. |
| Polymer AI | Instant dashboards with sharing | Starter and Pro tiers, public pricing shows monthly and yearly options plus a 7-day trial | AI-generated dashboards, connectors, hourly to real-time syncing on higher tiers. |
5. Tool-By-Tool, What You Can Do Today
5.1 ChatGPT, Advanced Data
What it does. Upload spreadsheets, ask for profiling, cleaning, and modeling, then request charts and a narrative. The File Uploads FAQ and the MIT guide confirm Advanced Data Analysis writes and runs Python on your behalf. Connectors bring in Drive and Microsoft files without downloading.
How to use it fast. Start a chat, attach a file, then say, “Profile columns, fix missing values, standardize dates, and show a before-after summary. Next, find three patterns worth investigating and create the best single chart for each.” That is artificial intelligence in data analysis at conversational speed.
5.2 Julius AI
What it does. Julius blends chat, notebooks, collaboration, and live data. The pricing page lists Free at 15 messages per month, Plus at 250, and Pro with unlimited messages and live connectors for Snowflake, BigQuery, and Postgres. Google Drive is available at Free and Plus.
Why it matters. If your team needs reproducible workflows and shared context, Julius fits. You get a paper trail from raw data to dashboards, plus the option to peek at or edit the underlying code. That is valuable when artificial intelligence in data analysis supports audited decisions.
5.3 Microsoft Copilot For Excel
What it does. Copilot sits inside Excel. It writes formulas, analyzes ranges for insights, creates PivotTables on request, and can help import data. Microsoft’s support docs cover each action, including a page dedicated to PivotTables and another on getting started. For individuals, Copilot Pro is 20 USD per user per month. For business, Copilot for Microsoft 365 is an add-on at 30 USD per user per month.
Why it matters. If your processes are Excel-native, this is the cleanest path to AI data analysis Excel work. You keep files in OneDrive, you stay in familiar cells, and you still capture the benefits of artificial intelligence in data analysis.
5.4 Polymer AI
What it does. Upload a file, get an interactive dashboard in seconds. Polymer markets AI-generated dashboards, insight text, and connectors with sync options that increase by tier. The pricing page lists Starter and Pro tiers with monthly and yearly options and a 7-day free trial.
Why it matters. You need a link you can share before the meeting ends. Polymer excels at that. For many teams, this is the first taste of artificial intelligence in data analysis that sticks.
6. Feature Matrix Table
| Capability | ChatGPT | Julius AI | Copilot For Excel | Polymer AI |
|---|---|---|---|---|
| File Uploads | Yes, with analysis and charts. Projects keep files organized. | Yes | Works in-place on Excel ranges | Yes |
| Drive Connectors | Google Drive, OneDrive, SharePoint, Dropbox, Box via Connectors. Workspace nuance for Google Drive. | Google Drive on Free and Plus. DB connectors on Pro. | Files saved to OneDrive for Copilot features. | Multiple data connectors with tiered sync. |
| Modeling And Code | Writes and runs Python in chat. | No-code front end with notebook and code views | Generates formulas and PivotTables, adds charts. | Auto-builds dashboards and insight text |
| Collaboration | Share chats, Projects for organization. | Shared workspaces and teams on Pro | Through Microsoft 365 sharing | Links and viewer access |
| Typical Entry Cost | Paid chat tier with file uploads and Connectors | Plus at 20 USD per month | Pro at 20 USD per month personal. Business add-on 30 USD per user per month | Public plans with monthly and yearly options, 7-day trial |
7. A Ten-Minute Example, From Messy CSV To A Decision
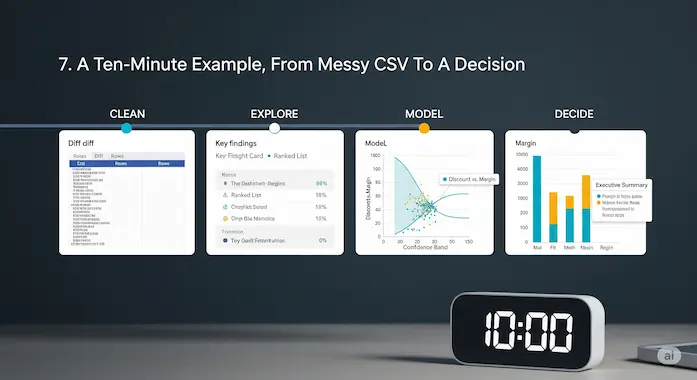
Imagine a file named sales_q3.csv with Date, Region, Product, Units, Revenue, Profit, Discount, and Rating. Typos in Region, missing Profit values, mixed date formats. You have a board meeting in an hour and a hunch that steep discounts crushed margin in the South.
Minutes 1 to 3. Clean. In ChatGPT, upload the file. Ask, “Profile columns, fix missing values, standardize dates to YYYY-MM, unify Region names, drop unrecoverable rows, and show a before-after sample.” Artificial intelligence in data analysis handles this in one pass.
Minutes 4 to 6. Explore. Ask, “Rank three patterns with the biggest impact on profit.” You get a short list. The South shows rising revenue with falling margin. Discount above 25 percent flips unit economics negative in two product lines. Ratings drop on heavily discounted orders. Ask for a scatter plot of Discount vs Margin with a fit line.
Minutes 7 to 8. Model. Say, “Estimate the effect of Discount on Margin controlling for Region and Product. Return coefficients and a plain English interpretation.” Now you have a quantified claim, not a hunch. That is artificial intelligence in data analysis doing real work.
Minutes 9 to 10. Decide. Ask, “Write a brief with three bullet points, a bar chart of margin by region, and a testable recommendation on discount policy for next month.” Paste it into your doc and walk in with a point of view.
8. How To Choose Your Stack With Confidence
Artificial intelligence in data analysis is a capability, not a brand. Start with your constraints.
- You need speed, single-file exploration, and code when needed. Use ChatGPT with file uploads and Connectors. It is the fastest path from question to prototype.
- You want shared context and live sources. Choose Julius AI. You get notebooks, collaboration, and database connectors on Pro.
- You must stay in Excel. Go with Copilot. It writes formulas, builds PivotTables, and analyzes ranges without leaving the workbook. That is AI data analysis Excel at its simplest.
- You need instant dashboards for stakeholders. Try Polymer. Upload, then share a live board with filters in minutes.
If budget is tight, look at free AI tools for data analysis to build the habit. Julius Free gives 15 messages per month, enough for small projects. Polymer offers a short trial that lets you validate a dashboard idea. ChatGPT’s free tier varies by feature, while paid ChatGPT unlocks reliable file analysis and Connectors at scale.
9. Common Pitfalls And The Simple Fixes
Artificial intelligence in data analysis is powerful. Judgment still matters.
- Unquestioned defaults. Ask for model assumptions. Inspect residuals. Look at distributions, not just means.
- Pretty charts, weak titles. Title with a takeaway. “South Margin Fell As Discount Rose” beats “Margin By Region.”
- Overfitting to last quarter. Use rolling windows and holdout periods. Ask for confidence intervals and sensitivity checks.
- Data drift. If you connect live sources, schedule schema checks and simple tests. When a column changes meaning, you want to know today.
10. Your First Week Plan
Artificial intelligence in data analysis gets sticky when everyone uses it a little, every day.
- Day 1. Clean one file and save a before-after sample.
- Day 2. Make one chart that explains last quarter and share it.
- Day 3. Write a two paragraph narrative. Edit it for voice.
- Day 4. Run one forecast with intervals and log the error next month.
- Day 5. If you live in spreadsheets, let Copilot write three formulas you usually Google. That is practical AI data analysis Excel work.
- Day 6. Connect one live source in Julius or Polymer and publish a dashboard.
- Day 7. Create a short checklist your team uses before publishing any claim.
11. The Human Analyst, Upgraded
The new tools do not end the role of analysts. They change the mix. Less time cleaning, more time questioning. Less time redrawing the same chart, more time shaping the next experiment. Artificial intelligence in data analysis is the tireless intern. You are the editor, the teacher, and the strategist.
Call to action. Pick one dataset that matters this week. Connect it to ChatGPT or fire up Julius, Copilot, or Polymer. Run the four-step AI data analysis process. Share one decision you could not have reached as quickly without it. Then repeat. The habit compounds, and so will your results.
- Data Analysis with ChatGPT
- File Uploads FAQ
- Connectors in ChatGPT
- Add Files from Connected Apps
- Synced Connectors in ChatGPT
- Google Drive Connector Setup
- Optimizing File Uploads
- Using Projects in ChatGPT
- Improvements to Data Analysis
- Julius AI Pricing
- Managing Julius Subscription
- Getting Started with Copilot in Excel
- Create PivotTables with Copilot
- Copilot Pro Store
- Microsoft Copilot Pricing
- Polymer Search Pricing
- Looker Studio vs Polymer
1. What is artificial intelligence in data analysis?
Artificial intelligence in data analysis is the use of machine learning, natural language interfaces, and generative models to turn raw data into decisions. Models clean messy spreadsheets, surface patterns, build forecasts, and then explain the results in plain English. It augments analysts, speeds up work, and helps non-technical teammates ask better questions and get credible answers.
2. Which AI tool is best for data analysis?
There is no single winner. Choose by workflow. ChatGPT is great for flexible, conversational work with file uploads and cloud connectors. Julius AI suits teams that need notebooks, live database connections, and collaboration. Microsoft Copilot for Excel helps people who live in spreadsheets. Polymer AI is ideal when you want instant interactive dashboards. Pick the tool that removes the most friction in your day, then add others as your needs grow. This approach covers both beginner and advanced AI tools for data analysis.
3. What is the AI data analysis process?
A reliable AI data analysis process has four steps. Ingest and clean the data, standardize formats, and fix errors. Explore and discover, rank outliers, correlations, and trends. Model and forecast, quantify relationships and project forward with confidence intervals. Communicate and decide, create clear charts and a short narrative that ties insights to actions. This is artificial intelligence in data analysis as a repeatable playbook.
4. Can I use AI for data analysis directly in Excel?
Yes. AI data analysis Excel workflows are now practical with Microsoft Copilot for Excel. You can highlight a range, ask for a summary, generate PivotTables, write formulas from plain English requests, and create charts without leaving the workbook. Keep files in OneDrive or SharePoint for the smoothest experience, then share results through normal Microsoft 365 sharing.
5. How much do AI data analysis tools cost?
You can start with free AI tools for data analysis that offer limited queries or short trials. Paid plans commonly begin around 10 to 30 USD per user per month for individual or starter tiers, with higher tiers adding collaboration, live database connectors, and faster usage limits. Budget by team role. Give power users a full plan, give viewers dashboard access, and scale up only when the workflows prove their value.