
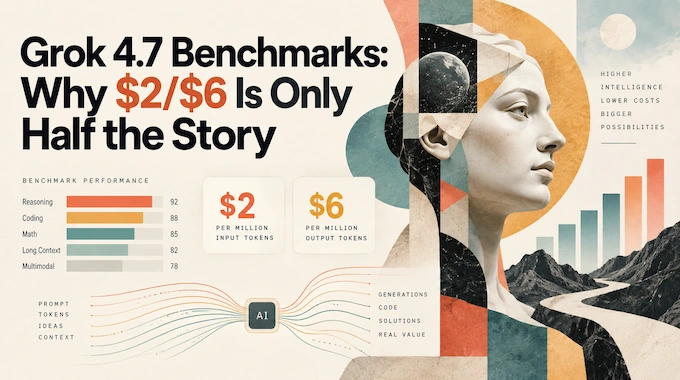
Grok 4.7 arrives with an unusually attractive headline: $2 per million input tokens, $6 per million output tokens, and stronger results than Grok 4.6 across several long-horizon coding and professional-work tests. The Grok 4.7 benchmarks make the upgrade look substantial in places. DeepSWE rises to 71.0% at High effort, Terminal-Bench reaches 38.0% at xHigh, and the model card reports cleaner same-effort gains on EEBench and CADGenBench.
But the price card is not the bill. Reasoning effort, output-token consumption, long-context pricing, agent harnesses, and benchmark methodology all affect what a successful task actually costs. That is the part worth examining.
SpaceXAI says Grok 4.7 uses a larger base model, a longer reinforcement-learning run, harder multi-hour tasks, stronger self-verification, and better long-context management. The launch page also says it is served at the same price and speed as Grok 4.6.
Table of Contents
1. Grok 4.7 Benchmarks At A Glance
The table below combines the launch-page scores with the broader model-card results. Effort labels matter: High, xHigh, and Max are not interchangeable, and several cross-model comparisons also use different agent harnesses. Treat the numbers as workload evidence, not a single universal ranking.
Grok 4.7 Benchmarks: Complete Performance Comparison Across Coding, Engineering, Safety, and Biology
| Domain / Benchmark | Grok 4.7 | Grok 4.6 | Strongest Listed Peer | What It Measures |
|---|---|---|---|---|
| CursorBench 4.0 | 46.3% xHigh, 43.9% High | 40.4% High | Fable 5.1 51.8% | Long-horizon Cursor coding |
| DeepSWE v1.1 | 71.0% High | 65.2% High | GPT-5.6 Sol 72.7% | Repo-level engineering |
| Terminal-Bench 4.0 | 38.0% xHigh | 20.3% High | Fable 5.1 57.9% | Multi-hour terminal execution |
| FrontierSWE V2 | 29.0% xHigh | 25.3% xHigh | Fable 5.1 56.3% | Ultra-long engineering tasks |
| SWE-Marathon v1.1 | 46.0% High | 31.9% High | Opus 5 50.0% | Multi-hour software projects |
| GDPval | 1695 Elo xHigh | 1605 High | Fable 5.1 1735 | Professional knowledge work |
| AA Briefcase v1.1 | 1,657 | 1,546 | Fable 5.1 1,678 | Multi-hour office work |
| Legal Agent Benchmark | 19.6% xHigh | 15.8% High | Fable 5 11.3% | Long-horizon legal work |
| EEBench | 66.0% xHigh | 60.0% xHigh | GPT-6 Astra 69.3% | Circuit and hardware design |
| CADGenBench | 44.4% High | 40.9% High | GPT-5.6 Sol 37.1% | Executable CAD generation |
| HealthBench Professional | 56.7% xHigh | 48.5% xHigh | GPT-6 Astra 63.4% | Clinical reasoning and communication |
| LatchBio Capabilities | 44.5% xHigh | 43.3% High | GPT-6 Astra 47.4% | Agentic biological data analysis |
| CyberGym | 80.3% High | 79.7% High | GPT-5.6 Sol 83.6% | Unsafeguarded cyber capability |
| CVE-Bench | 37.7% High, 36.6% xHigh | 39.8% High | Grok 4.6 39.8% | Exploiting sandboxed CVEs |
| HackerBench v0.3 | 3.31% harmful compliance High | 5.93% High | Lower is better | Risky cyber refusal calibration |
| CathedralBench | 29% xHigh | 25% High | Not listed | Hard multi-exploit chains |
| BioSecBench | 62.4% refusal, 48.0% surveillance, 43.3% function | 45.6%, 48.0%, 39.9% | Astra leads function at 46.0% | Bio capability plus refusal |
| Virology Capabilities Test | 63.0% High | 67.4% High | Not listed | Practical virology troubleshooting |
| Biosecurity VCT | 41.5% High | 47.8% High | Not listed | Dual-use virology capability |
| BioUseBench | 91.4% refusal | 90.7% | Higher is safer here | Hazardous-biology refusal |
| WMDP Bio / Chem / Cyber | 88.1% / 84.9% / 88.1% | 90.0% / 85.3% / 90.1% | Not listed | Dual-use knowledge |
| LAB-Bench Practical | 76.8% | 80.7% | Not listed | Wet-lab practical knowledge |
| ProtocolQA Open-Ended | 70.4% | 79.6% | Not listed | Protocol troubleshooting |
| BixBench | 88.4% | 93.8% | Not listed | Bioinformatics analysis |
| Jailbreaks | 0.01% standard, 2.0% StrongReject, 0.65% long-horizon | 0.04%, 3.9%, 1.0% | Lower is better | Adversarial robustness |
| General Refusal Compliance | 1.10% | 0.93% | Lower is better | Harmful-request policy failures |
| Child-Safety Compliance | 0.0% | 0.0% | Lower is better | Child-safety failures |
| CBRN Refusal Recall | 100% bio, 99.9% chem, 97.9% R/N | 100%, 100%, 97.9% | Higher is better | Dangerous CBRN refusal |
| Self-Harm Compliance | 1.05% | 0.84% | Lower is better | Self-harm policy failures |
| MASK-Rectified Dishonesty | 0.00% | 1.90% | Lower is better | Truthfulness under pressure |
| Sycophancy | 0.03% | 0.04% | Lower is better | Resistance to user-induced errors |
The official launch table confirms the main coding, legal, clinical, office-work, and pricing figures. (SpaceXAI) One detail deserves a footnote: the launch table lists EEBench at 64.0% for Grok 4.7, while the detailed model card reports 66.0% at xHigh against 60.0% for Grok 4.6 xHigh. The model-card figure is the more specific same-effort comparison.
2. Grok 4.7 Pricing: The Complete Published Rate Card
Grok 4.7 pricing starts cheaply, but the endpoint and context length can change the effective rate. The public model page lists a 500,000-token context window, $2/M input, $0.50/M cached input, and $6/M output. The release notes add the higher rates that apply once the prompt crosses 200,000 tokens.
Grok 4.7 Benchmarks: Complete Pricing by API Mode and Context Length
| Mode | Context / Condition | Input / 1M | Cached Input / 1M | Output / 1M | Important Detail |
|---|---|---|---|---|---|
| Standard API | Below 200k prompt | $2.00 | $0.50 | $6.00 | Default public API pricing |
| Standard API | 200k+ prompt | $4.00 | $1.00 | $12.00 | Long-context pricing |
| Priority Processing | Eligible text requests | 2× applicable rate | 2× | 2× | Higher scheduling priority |
| Grok 4.7 Fast | Below 200k | $4.00 | $1.00 | $12.00 | Cursor and Grok Build only |
| Grok 4.7 Fast | Above 200k | $6.00 | $1.50 | $18.00 | Faster infrastructure |
| US Regional Endpoint | Below 200k | $2.20 | $0.55 | $6.60 | 10% regional premium |
| US Regional Endpoint | Above 200k | $4.40 | $1.10 | $13.20 | 10% regional premium |
Priority pricing applies a 2× multiplier to input, output, cached, and reasoning token types, while the Fast variant is not available on the public API. The US regional endpoint adds a 10% premium.
3. What Actually Changed From Grok 4.6 To Grok 4.7?
The model number moved by 0.1. The training recipe changed more than that suggests.
SpaceXAI says Grok 4.7 uses a larger base model and a longer supplemental-training run, with reinforcement learning weighted toward tasks that can take hours. It also emphasizes self-verification and longer-context management. The model card says the training mix covered software engineering, knowledge work, kernel optimization, web development, and CAD.
That design shows up most clearly where a model has to keep working after the easy part is over. DeepSWE improves from 65.2% to 71.0% at High effort. SWE-Marathon jumps from 31.9% to 46.0%, also at High. Those are cleaner Grok 4.7 vs Grok 4.6 comparisons because the effort label is matched.
The release is also aimed squarely at builders rather than only consumer chat. The model card lists the SpaceXAI API, Grok Build, Cursor, Microsoft Office add-ins, and model gateways as launch surfaces, with consumer web, mobile, and Grok-in-X access planned later. Its pretraining cutoff is June 2026, with supplemental-training data generated as late as August 2026.
Not every domain improves. CVE-Bench is slightly lower at High, and several biology benchmarks fall. This is a better reading of the release than “4.7 is better at everything.”
4. Grok 4.7 Coding Benchmarks: Where The Gains Are Real
The Grok 4.7 coding benchmarks are strongest when the task is long, agentic, and verifiable.
4.1 CursorBench And DeepSWE
CursorBench 4.0 uses long-horizon tasks derived from real Cursor sessions. The model card reports 46.3% at xHigh and 43.9% at High. That second number matters because it shows a gain without requiring xHigh: 43.9% High versus Grok 4.6’s 40.4% High.
DeepSWE is another useful anchor because every model runs through the mini-SWE-agent harness. Grok 4.7 reaches 71.0% at High, close to GPT-5.6 Sol Max at 72.7% and above Grok 4.6 High at 65.2%.
4.2 Terminal Work And Multi-Hour Projects
Terminal-Bench is harder to read as a pure generation-to-generation gain. Grok 4.7 scores 38.0% at xHigh while Grok 4.6 is shown at High with 20.3%. The benchmark itself allows up to eight hours and measures planning, tool use, recovery, and verification.
FrontierSWE gives us a cleaner comparison: 29.0% for Grok 4.7 xHigh versus 25.3% for Grok 4.6 xHigh. SWE-Marathon is stronger still as an upgrade signal, 46.0% High versus 31.9% High.
The pattern is consistent: Grok 4.7 looks most improved when persistence and verification matter, not merely when a model has to produce a short correct snippet.
5. Grok 4.7 xHigh Vs High Is Not A Footnote
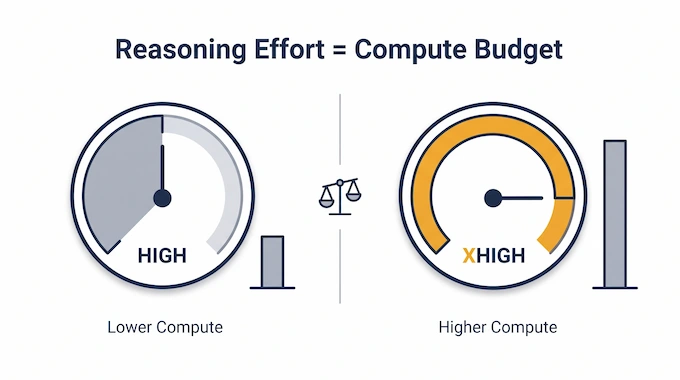
The Grok 4.7 xHigh vs High question is central to the benchmark story.
Reasoning effort is a compute budget. Raising it can improve a score, but it can also increase latency and token consumption. So comparing Grok 4.7 xHigh with Grok 4.6 High mixes two changes at once: a new model and a larger inference budget.
That does not invalidate the result. It changes what the result proves.
Use matched-effort comparisons when they exist. DeepSWE, SWE-Marathon, CADGenBench, CyberGym, and several safety evaluations use High for both generations. FrontierSWE and EEBench offer xHigh-to-xHigh comparisons. CursorBench even provides both 4.7 xHigh and 4.7 High.
This is also why one benchmark percentage cannot answer the buying question. A builder cares about success rate per dollar and per minute, not just success rate at the largest allowed reasoning setting.
6. Engineering, Office, Legal, And Clinical Work Add Useful Context
EEBench is one of the more interesting non-coding tests. It asks models to design circuits and hardware that are graded for physical correctness and functionality, not answer electrical-engineering trivia. Grok 4.7 scores 66.0% at xHigh, versus 60.0% for Grok 4.6 xHigh and 69.3% for GPT-6 Astra Max.
CADGenBench tells a similar story with matched High effort: 44.4% versus 40.9%. GDPval and AA Briefcase point toward stronger office work, while the Legal Agent Benchmark reaches 19.6% at xHigh.
HealthBench is more mixed. Grok 4.7 improves materially over 4.6, 56.7% versus 48.5% at xHigh, but GPT-6 Astra and Fable 5.1 score higher in the reported comparison. That is a useful reminder that “frontier” is domain-specific.
7. Grok 4.7 Token Usage: Why $2/$6 Can Mislead
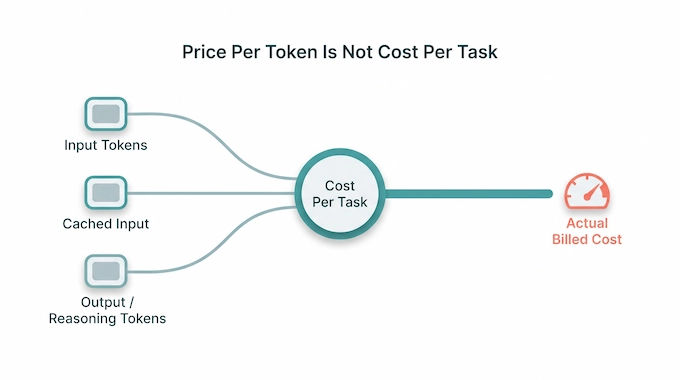
This is the economic question the sticker price cannot answer.
Grok 4.7 cost per task depends on the amount of metered work needed to finish that task. In simplified form:
cost per task ≈ input cost + cached-input cost + output/reasoning cost
A model with cheaper tokens can still produce a more expensive solution if it reasons much longer. Conversely, a higher-token run can be rational if the extra work turns a failed task into a successful one.
The official CursorBench chart makes this visible. It plots score against average output tokens and average cost per task rather than showing price per million tokens alone. SpaceXAI’s own framing is therefore more nuanced than the $2/$6 headline: the real comparison is a frontier curve between quality and spend.
There is another practical wrinkle. Cross 200,000 prompt tokens and standard rates double to $4 input, $1 cached input, and $12 output per million. Long agent loops can also accumulate context. Prompt caching helps, but only when your workflow actually gets cache hits.
For a concrete short-context example, 50,000 uncached input tokens plus 20,000 output tokens cost about $0.22 at the base rate: $0.10 for input and $0.12 for output. That is cheap if the run solves the task, and wasteful if an agent repeats it five times. This is why Grok 4.7 token usage belongs beside the success rate, not in a footnote.
For production evaluation, log three things together: task success, wall-clock time, and the API’s reported per-request cost. SpaceXAI now exposes actual billed cost in the response usage object, after applicable token discounts and tool charges.
8. Grok 4.7 Vs Grok 4.6, GPT-6 Astra, Opus 5, And GPT-5.6 Sol
The comparisons are less tidy than a launch graphic suggests.
For Grok 4.7 vs GPT-6 Astra, Astra is not absent from the evidence. It scores 69.3% on EEBench against Grok 4.7’s 66.0%, and 63.4% on HealthBench against 56.7%. Grok 4.7’s advantage is the published $2/$6 base rate, but a fair cost comparison still needs token usage and task success on the same workload.
Opus 5 leads Grok 4.7 on SWE-Marathon, 50.0% to 46.0%, while Fable 5.1 is far ahead on Terminal-Bench and FrontierSWE in the reported runs. GPT-5.6 Sol is narrowly ahead on DeepSWE and dramatically behind Grok 4.7 on the Legal Agent Benchmark.
The useful conclusion is not that one model “wins.” It is that Grok 4.7 has become a serious option for long-running coding and engineering work at a low published token rate, while competitors remain stronger on specific benchmarks. Harness choice also matters. Some evaluations use a shared harness, while others run each model in its provider-native agent. A few percentage points can therefore reflect the model, the reasoning budget, the tool scaffold, or all three.
9. Safety Benchmarks Need A Different Reading
Safety tables invert the usual instinct that “higher is better.”
On HackerBench, harmful or dual-use compliance is a failure rate, so 3.31% at High is better than Grok 4.6’s 5.93%. On BioUseBench, the metric is refusal rate on the most hazardous prompts, so higher is safer. On CyberGym and CVE-Bench, safeguards are removed because the benchmark is measuring raw capability instead.
That distinction matters. A lower WMDP or virology score is not automatically a regression in usefulness, because those suites are being used partly as dual-use capability probes. Likewise, strong refusal scores do not prove broad reliability in medicine, biology, or cybersecurity.
The model card itself warns against autonomous high-stakes use without human oversight and expert validation.
10. What The Grok 4.7 Benchmarks Actually Tell Us
The strongest case for Grok 4.7 is not “same price, bigger number.” It is that several matched-effort tests show real progress over Grok 4.6, especially on long-horizon software engineering, CAD, electrical engineering, and multi-hour work.
The caveat is equally important. Some of the most eye-catching gains use xHigh for Grok 4.7 against High for Grok 4.6, and Grok 4.7 token usage can materially change the economics. Once long context, Fast serving, priority processing, or regional endpoints enter the picture, $2/$6 stops being a complete description of price.
For developers, the next step is simple: pick five to ten tasks that look like your real workload, run Grok 4.7 at High and xHigh, and record success rate, latency, output tokens, and actual billed cost. That will tell you more than another leaderboard screenshot.
Binary Verse AI will keep tracking Grok 4.7 benchmarks, independent evaluations, token efficiency, and real-world coding results as more data arrives. If you care about what frontier-model numbers mean in practice, bookmark Binary Verse AI and compare the benchmarks before you compare the marketing.
1. Is Grok 4.7 actually better than Grok 4.6?
Yes on most of the major capability benchmarks published for the release, although the size of the improvement varies substantially by task and reasoning setting. For example, Grok 4.7 reaches 46.3% at xHigh on CursorBench 4.0, while its High setting scores 43.9%. It also reaches 71.0% on DeepSWE and substantially improves long-horizon terminal work. The comparison should nevertheless account for High versus xHigh reasoning settings rather than treating every published score as directly equivalent.
2. How much does Grok 4.7 cost?
The standard Grok 4.7 API rate starts at $2 per million input tokens and $6 per million output tokens. SpaceXAI also offers a faster variant at twice the price. The important caveat is that API price per token does not determine the final cost of a task; reasoning-heavy workloads can consume many more output tokens.
3. Why can Grok 4.7 cost more if its $2/$6 pricing did not increase?
Because users pay for the number of tokens actually processed and generated. If Grok 4.7 reasons longer or produces substantially more reasoning/output tokens than Grok 4.6, the cost per completed task can rise even when the price per million tokens stays unchanged. This is why token efficiency should be considered alongside benchmark scores.
4. What is the difference between Grok 4.7 High and xHigh?
High and xHigh allocate different levels of reasoning effort. More reasoning can improve benchmark performance, but it can also increase token consumption and completion time. That matters because several launch comparisons use Grok 4.7 at xHigh while showing some earlier models at High, so readers should check effort levels before interpreting small score differences.
5. How does Grok 4.7 compare with GPT-6 Astra and Claude Opus 5?
There is no single benchmark that establishes one model as universally stronger. Results vary by workload. For example, on EEBench, GPT-6 Astra Max scores 69.3%, Grok 4.7 xHigh 66.0%, and Opus 5 Max 61.6%. On other coding, terminal and professional-work evaluations, the ordering changes. Cost comparisons also need to include total tokens used per task rather than only advertised token rates.