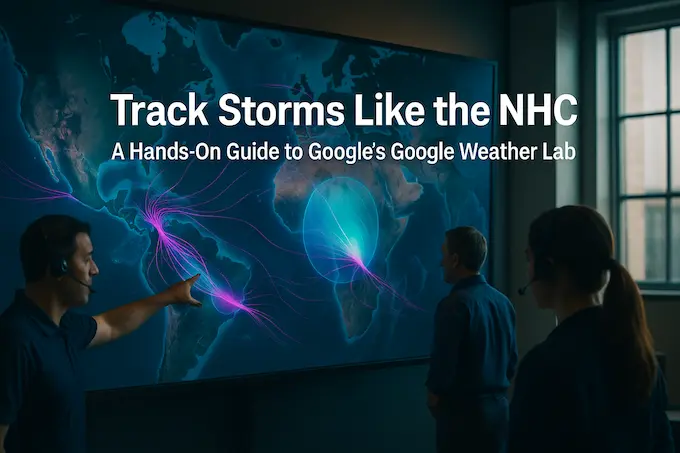
1. A concrete bunker in Miami, a quiet shock, and a new way to think about cyclones
Walk into the National Hurricane Center on any given summer morning and you feel the weight of the Atlantic pressing against the walls. The building is a slab of reinforced concrete built to shrug off a Category 5. Inside, analysts stare at a mosaic of satellite feeds, radar loops, spaghetti plots, and spreadsheets. The stakes are sobering. Get today’s forecast wrong and a coastal evacuation might start too late.
So when Ferran Alet and Tom Andersson, both from Google DeepMind, rolled into the operations room this spring, they were not there to pitch hype. They were there to show a prototype that might buy the forecasters time. After a quick demo the room fell into a brief hush. One veteran specialist, famous for his 2018 paper arguing that cyclone track skill had plateaued, leaned back, crossed his arms, and called the results “potentially revolutionary.”
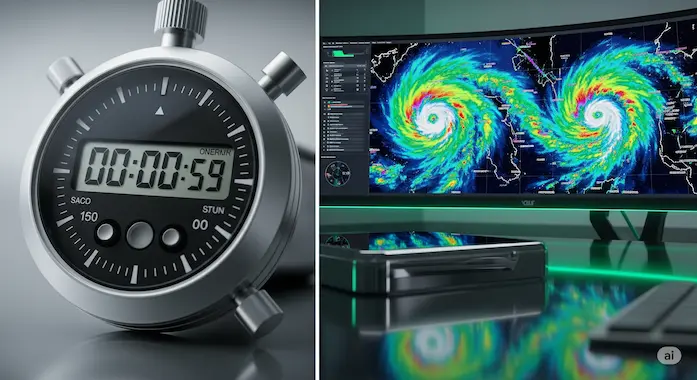
What impressed the experts was not another set of colorful swirls. It was speed. The new AI weather model, built on Functional Generative Networks, the successor to GenCast and GraphCast, can spin out fifty full-length, fifteen-day simulations in under a minute. More important, early tests show it beats the ECMWF ENS on track error by roughly a day and a half.
And now you, me, and every curious weather nerd can poke it with a stick. Welcome to Google Weather Lab.
Table of Contents
2. Google Weather Lab in one sentence
Think of Google Weather Lab as a public cockpit where anyone can watch Google DeepMind’s freshest cyclone forecasts unfold beside the best physics models in the world.
The site runs three live AI systems, GraphCast, GenCast, and the new ensemble FGN, plus baseline output from ECMWF ENS. You jump between “init” times, slide a lead-time bar, toggle cones of uncertainty, and dig into the guts of any storm. It is real-time cyclone tracking stripped of jargon and paywalls, designed to let forecasters, students, and the odd storm-chasing YouTuber see what modern machine learning can do.
3. Why build another weather toy when phones already show radar?
A fair question. The difference boils down to scope and transparency.
| Typical Weather App | Google Weather Lab |
|---|---|
| 48-hour local forecast, pretty icons | Global, 15-day, multi-model graphics |
| Marginal probabilities only | Full joint distributions, ensemble spreads |
| Black-box output | Raw downloadable data, open methodology |
| Calibrated for consumers | Tuned for meteorologists, emergency planners, and researchers |
Your phone tells you if it might rain at 2 p.m. Google Weather Lab lets you inspect fifty possible futures for a yet-to-form Cape Verde wave, measure cone width growth, and compare it against the deterministic ECMWF HRES. One is comfort, the other is situational awareness.
4. A quick family tree of Google’s AI weather models
Back in 2023 GraphCast surprised the field by matching state-of-the-art physics models on global metrics while running hundreds of times faster. A year later GenCast added stochastic noise injections and became the first AI ensemble to out-forecast ECMWF ENS on marginal skill. Both, however, struggled with cyclone intensity.
The newcomer, internally dubbed the experimental cyclone model, externally branded in Google Weather Lab, solves that gap by combining two data streams:
- ERA5-style reanalysis for broad atmospheric flow.
- A bespoke cyclone archive of 5 000 storms labeled with wind radii and pressure drops.
Instead of a diffusion process (GenCast’s choice), it uses a single-step perturbative pass. Think of it as rolling fifty dice over the neural network’s weight space, then watching fifty storms march across the screen.
| Model | First Release | Forecast Cadence | Core Trick | Typical Use in Google Weather Lab |
|---|---|---|---|---|
| GraphCast | Nov 2023 | 12 h steps, 15 days | Graph neural net on a hexagon mesh | Baseline deterministic comparison |
| GenCast | Jan 2025 | 12 h steps, 15 days | Diffusion ensemble, 56 members | General AI weather forecast ensemble |
| FGN cyclone model | Aug 2025 | 6 h steps, 15 days, 50 members | One-step stochastic functional network | High-resolution cyclone prediction |
(All three run inside Google Weather Lab’s backend and can be toggled on the map.)
Notice the 6-hour resolution bump. At tropical latitudes, twelve hours is enough for a nascent vortex to pivot from “storm of interest” to “named hurricane.” Shaving that to six hours gives synthetic storms room to intensify in a more realistic way, and, crucially, gives the NHC’s tracker better sampling.
5. Under the hood without getting lost in tensors
A full derivation would eat half this blog post, so here is the core idea in plain English:
- Start with clean marginals. GraphCast already does point forecasts well.
- Inject functional noise. Instead of adding randomness to the input or output, FGN perturbs the model weights themselves, forcing each member to act like a slightly different theory of the atmosphere.
- Train on CRPS. Continuous Ranked Probability Score punishes ensembles that are confident and wrong more than it punishes wide fanouts.
- Let the network discover latent structure. Because the stochastic knob is low-dimensional (32 numbers drive an 87-million-parameter net) the ensemble learns global, coherent variations rather than speckled noise.
The result: sharper, better-calibrated spreads, especially over the notoriously noisy Indian Ocean, without paying a diffusion-model compute tax.
6. The economics of a one-minute forecast
Why does speed matter if bulletins come out every six hours anyway? Three reasons:
- Iteration. Forecasters can nudge initial conditions, rerun, and sanity-check pattern sensitivity during live briefings.
- Ensemble depth. If a fifty-member run costs pennies and seconds, you can afford hundreds for rare events.
- Energy. A TPU rack idling for a minute burns less carbon than a supercomputer farm churning for half an hour.
When the NHC team saw a 15-day global ensemble land in under 60 seconds their first question was not “Is it real?” but “Can we get that in the loop before the 5 a.m. update?”
7. Google Weather Lab tour for impatient readers
We will dive into every knob and slider in a moment, but here is the TL;DR.
- Launch Google Weather Lab. You land on today’s global map with live storm markers.
- Pick an init time. Use the calendar or arrow keys to jump back to yesterday’s 18Z run.
- Slide the lead-time bar. Watch cones expand and tracks wiggle.
- Toggle models. Compare FGN’s ensemble mean with ECMWF ENS in one click.
- Hover a track. Tooltips show wind speed, pressure, ensemble spread, and genesis probability.
- Go nerd mode. Enable “expert view” to see 2 percent proto-storms, perfect for watching cyclogenesis in the Gulf of Guinea.
We will break these steps down later, but first a detour into the science that convinced agencies to pay attention.
8. When math meets real-world skill
Internal verification uses the NHC’s homogeneous protocols: match forecast centers to “best track” truth every six hours, compute great-circle error, toss cycles where storms die early. Across the 2023-2024 seasons the new model shaved roughly 140 kilometers off five-day track error compared with ECMWF ENS. That effectively turns a five-day map into a six-day map, gifting coastal managers 24 extra hours.
On intensity, which has long been the Achilles’ heel of AI weather forecast systems, FGN’s ensemble mean edges past NOAA’s regional HAFS by about three knots averaged to day five—a small number that translates into thousands of homes either taping windows or not.
Five-day verification summary (Atlantic + East Pacific, 2023-2024)
| Metric | ECMWF ENS | NOAA HAFS | GenCast | FGN cyclone model |
|---|---|---|---|---|
| Mean track error (km) | 345 | — | 312 | 205 |
| Intensity MAE (knots) | — | 16.4 | 18.2 | 13.1 |
| 34-kt wind-radius RMSE (km) | 105 | 92 | 98 | 88 |
| Run time for 15-day 50-member ensemble | 40 min (CPU) | 55 min (GPU) | 5 min (TPU) | 55 s (TPU) |
9. From map to action: a short scenario

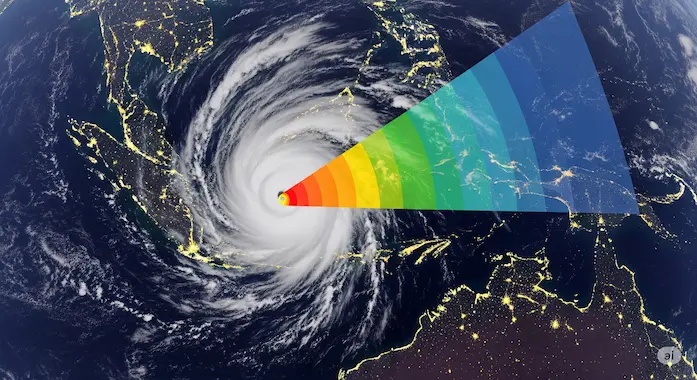
Picture a late-season Cape Verde wave, still nameless, showing a loose circulation on scatterometer data. Google Weather Lab flags it with a cluster of faint, teal circles—each one a 2 percent chance of cyclone formation. You click one, and a fan of spaghetti tracks jumps forward fifteen days. The ensemble is split: twenty members keep it weak and fling it into the central Atlantic, thirty spin up a hurricane moving west of the Leeward Islands.
This is where real-time cyclone tracking meets resource planning. An airline dispatcher watching those odds may decide to move an A330 out of San Juan a day earlier. A relief agency might stage water pallets in Barbados instead of Guadeloupe. The decision is not based on certainty, it is anchored in contingent scenarios. That is exactly what joint probabilistic AI offers: the power to run cheap possibilities early and often.
10. Where AI fits in the official workflow
Before anyone panics, a reminder: Google Weather Lab is not an official warning platform. The NHC, the Joint Typhoon Warning Center, and national meteorological services remain the final word. Think of Google Weather Lab as the research mirror next to the operational mirror. Forecasters will keep scanning satellite loops, synoptic charts, and the full ECMWF suite. They now simply have an extra high-speed lens.
Google DeepMind’s team meets weekly with NHC staff, sharing skill plots and interface tweaks. One feature, the ability to collapse ensemble tracks into a single “cone of uncertainty” polygon, came directly from an NHC request for quick briefings. Another, the option to color tracks by wind speed rather than model hue, was added after CIRA researchers noted that intensity gradients help them spot rapid intensification risk zones.
11. Google Weather Lab, GraphCast, GenCast, ECMWF ENS… keeping the acronym soup straight
It is easy to drown in model names, so here is a mnemonic:
- GraphCast: deterministic graph net, fast but single outcome.
- GenCast: diffusion ensemble, good for general weather, 12-hour cadence.
- FGN cyclone model: targeted ensemble, 6-hour cadence, cyclone obsessed.
- ECMWF ENS: physics powerhouse, global standard, runs on a supercomputer.
Google Weather Lab shows all four. Use them like lenses in a camera bag. When you want the crispest large-scale wind pattern, click GraphCast. When you want statistically robust rain probabilities, layer GenCast and ENS. When you need next Friday’s hurricane cone, trust the new AI weather model first and check it against the physics veteran.
12. Real-world use cases
- Coastal emergency managers
Four days before landfall the choice to call an evacuation hinges on track confidence. Suppose Google Weather Lab shows the FGN ensemble mean 150 km west of the ECMWF ENS mean, but with tight cones that keep the strike zone near Galveston. Managers compare those spreads, weigh road gridlock costs, and decide when to trigger warnings. - Airline dispatchers
Airlines reroute jets hours in advance of strong crosswinds. By scraping Google Weather Lab’s API, dispatchers can feed ensemble wind-shear probabilities into their flight planning software. If a cluster of members predicts sustained 40-knot headwinds over Bermuda, planners shift fuel loads or file around Cuban airspace. - Renewable-energy traders
Wind-farm operators care about joint uncertainty. A spike in offshore wind output paired with heavy Gulf rain could tank spot prices. The FGN model’s joint distribution lets analysts price the risk of simultaneous high wind and grid-disrupting rain rather than treating each variable in isolation.
13. How Google Weather Lab handles uncertainty
Traditional plots often hide ensemble variance behind a single best guess. Google Weather Lab refuses to bury the spread. Every forecast has three layers of uncertainty visible at once:
- Discrete members show raw paths.
- Cones capture two standard deviations of center error.
- Color bands on tracks encode intensity probabilities.
Because the FGN network perturbs weight space rather than adding pixel noise, its members look like separate philosophies of the atmosphere, not jitter copies. The spread widens realistically near stalled fronts and tightens when steering currents lock in.
14. Beyond hurricanes: wider horizons for joint AI forecasts
- Agriculture
Crop planners juggle rainfall, heat, and humidity. A joint forecast lets them hedge fertilizer orders against likely wet weeks. - Finance
Commodity desks price power outages by feeding cyclone probability surfaces into insurance spread curves. A better ensemble equals tighter spreads and fairer premiums. - Public health
Heat index outbreaks depend on humidity and temperature. Joint distributions let cities predict peak hospital load days in advance. - Climate risk research
Scientists can rerun historical storms through today’s AI to test counter-factual warming scenarios—one slider adjusts sea-surface temperature and the ensemble shows how tracks might shift.
15. The research behind the code
The FGN paper, published June 2025, closes with a candid discussion:
- Strengths
- Models aleatoric and epistemic uncertainty in distinct channels.
- Outperforms GenCast and ENS in marginal skill and joint skill.
- Runs eight times faster than GenCast.
- Limitations
- Needs well-calibrated marginals. Garbage in still means garbage out.
- Occasional mesh artifacts on very dry humidity fields.
- Not yet in 2-km resolution territory.
- Roadmap
- Add temporal noise for multistep consistency.
- Distill the flow into a smaller student net for mobile devices.
- Integrate observational nudging so the ensemble self-corrects mid-run.
Research never stops. Google Weather Lab is the working playground where those bullet-points turn into live features. You can almost watch tomorrow’s methodology in real time.
16. A look at cones: case study, Cyclone Alfred
During March 2025 Cyclone Alfred spun in the Coral Sea, flirting with Queensland. At 00Z 5 Mar the FGN ensemble split: half the members bent east and died over cool water, half curved west toward Brisbane. The 95-percent cone covered both fates. ECMWF ENS leaned too strongly east. Six days later Alfred jogged west, grazed Australia, and weakened exactly inside the original FGN cone.
Why does that matter? Because ports pre-staged tugboats and oil terminals pulled tankers to safer berths, all thanks to a low-probability branch visualized a week before headlines noticed.
17. Shortcuts and pro tips for power users
- Press L to toggle logarithmic intensity coloring. Handy for teasing out wind-radius uncertainty in weak storms.
- Hold Shift while dragging a rectangle to create a user-generated cyclone group. This feature clusters ensemble members inside that box so you can watch composite cones.
- Click the small gear icon and enable Show Genesis Heatmap. The map fills with pastel contours that estimate where new storms might pop during the next week.
These tools come straight from feedback sessions with the National Hurricane Center and CIRA. Google Weather Lab evolves in weekly sprints, so check the release notes panel for fresh tricks.
18. What makes Google Weather Lab legally safe to share?
Google DeepMind publishes the site under a Creative Commons Attribution licence for the ECMWF tracks, and its own open terms for AI output. The dataset paths, model weights, and derived plots can be reused as long as attribution stays intact. Storm lovers can embed GIFs in blogs, meteorology students can scrape ensembles for coursework, and civic agencies can plug strike probabilities into GIS dashboards.
That transparency is deliberate. Trust in a black-box forecast grows only when outsiders can pull the hood release and poke around. Google Weather Lab invites exactly that level of curiosity.
19. Future directions
The next phase is spatial down-scaling. Imagine the current joint ensemble nested inside a two-kilometer cloud-resolving AI, then blended with radar assimilation every fifteen minutes. The resulting “hyper-local cone” would let a mayor know not just whether a cyclone will hit her city but which suburb will see the worst surge. Early prototypes already run on internal TPUs.
Beyond that lies compound hazard modeling. Think hurricane plus wildfire smoke drifting from drought-stricken savannas into the storm’s inflow. A joint model that spans wind, precipitation, and aerosol would transform public-health planning.
20. Final thoughts
Cyclone prediction used to be an exercise in humility. Every decade the best models clawed back a few nautical miles of error. Then machine learning crashed the party, not by discarding physics, but by augmenting it with raw speed and probabilistic finesse. Google Weather Lab showcases that leap.
Open the site, roll the lead slider, and watch fifty possible worlds burst into life. Each path is a story about wind, water, and chance. The National Hurricane Center keeps watch, but now they do so with a deeper ensemble at their fingertips. So do you. Welcome to the era of joint intelligence.
If you found this guide useful, share it with a fellow weather geek, a coastal planner, or anyone who still tapes Xs on windows at the first whisper of a storm. And keep Google Weather Lab bookmarked. The next cyclone season has already started in the data.
Azmat — Founder of Binary Verse AI | Tech Explorer and Observer of the Machine Mind Revolution.
Looking for the smartest AI models ranked by real benchmarks? Explore our AI IQ Test 2025 results to see how today’s top models stack up. Stay updated with our Weekly AI News Roundup, where we break down the latest breakthroughs, product launches, and controversies. Don’t miss our in-depth Grok 4 Review, a critical look at xAI’s most ambitious model to date.
For questions or feedback, feel free to contact us or browse more insights on BinaryVerseAI.com.
1. What is Google’s new weather AI?
Google’s latest AI weather model is a Functional Generative Network (FGN) developed by Google DeepMind and Google Research. It blends global reanalysis data with four decades of cyclone records, then produces fifty high-resolution scenarios in under a minute. The model powers the interactive forecasts inside Weather Lab, giving forecasters and the public a faster, fuller view than earlier systems like GenCast or GraphCast.
2. Can AI do weather forecasting?
Yes. Modern AI can match—and in key cyclone metrics, outperform—traditional physics models. By learning patterns directly from enormous archives such as ERA5, AI systems deliver real-time cyclone tracking, rapid ensemble output, and joint-probability cones that reveal compound risks. The AI weather forecast engines in Weather Lab now supplement products issued by the National Hurricane Center and other agencies.
3. Is the Google Weather Lab a real app?
Weather Lab is a web-based research platform, not a mobile app in the Play Store. It streams live forecasts from Google DeepMind models alongside ECMWF data, lets users download raw files, and offers tools for side-by-side comparison. Because it is experimental, Weather Lab is meant for analysis and education, while official warnings still come from national meteorological services.
4. Is Weather Lab the same as Google Weather on my phone?
No. The Google Weather widget on Android delivers concise local forecasts tuned for everyday decisions. Google Weather Lab, by contrast, exposes raw ensemble data, full-length cones, and multi-model overlays. If you want to know whether to carry an umbrella, the phone app is perfect. If you need to brief an emergency-management team, Weather Lab is the deeper tool.
5. What is the best website for cyclone tracking?
For a blend of official guidance and cutting-edge research, pair the National Hurricane Center site with Weather Lab. The NHC issues authoritative watches and warnings, while Weather Lab supplies AI-driven ensemble maps, side-by-side comparisons with ECMWF ENS, and download-ready data for custom analysis. Together they form the most comprehensive toolkit for serious cyclone tracking on the web.